BI Mastery for Dynamics 365
Power BI for Dynamics 365
Elevate your decision-making and drive success with our cutting-edge Business Intelligence for Microsoft Dynamics solutions. Seamlessly integrate business intelligence into your Dynamics 365 platform with dashboard finance and operations to gain valuable insights, streamline operations, and maximize ROI.
Driving Success with Business Intelligence
Agility and responsiveness are key to success in today's fast-paced business environment. Many organizations struggle to maintain this competitive edge due to inadequate insights, time-consuming data analysis, and a lack of ability to spot trends. As a result, businesses may face errors, delays, and difficulties in identifying customer preferences and optimizing resources. However, with the right tools and strategies, businesses can overcome these challenges and stay ahead in the game.
Power BI Dynamics 365 is indispensable for data-driven decision-making and streamlined operations. At DynaTech, we provide the expertise to flawlessly integrate this essential tool, empowering you to unlock the full potential of your data with utmost confidence.
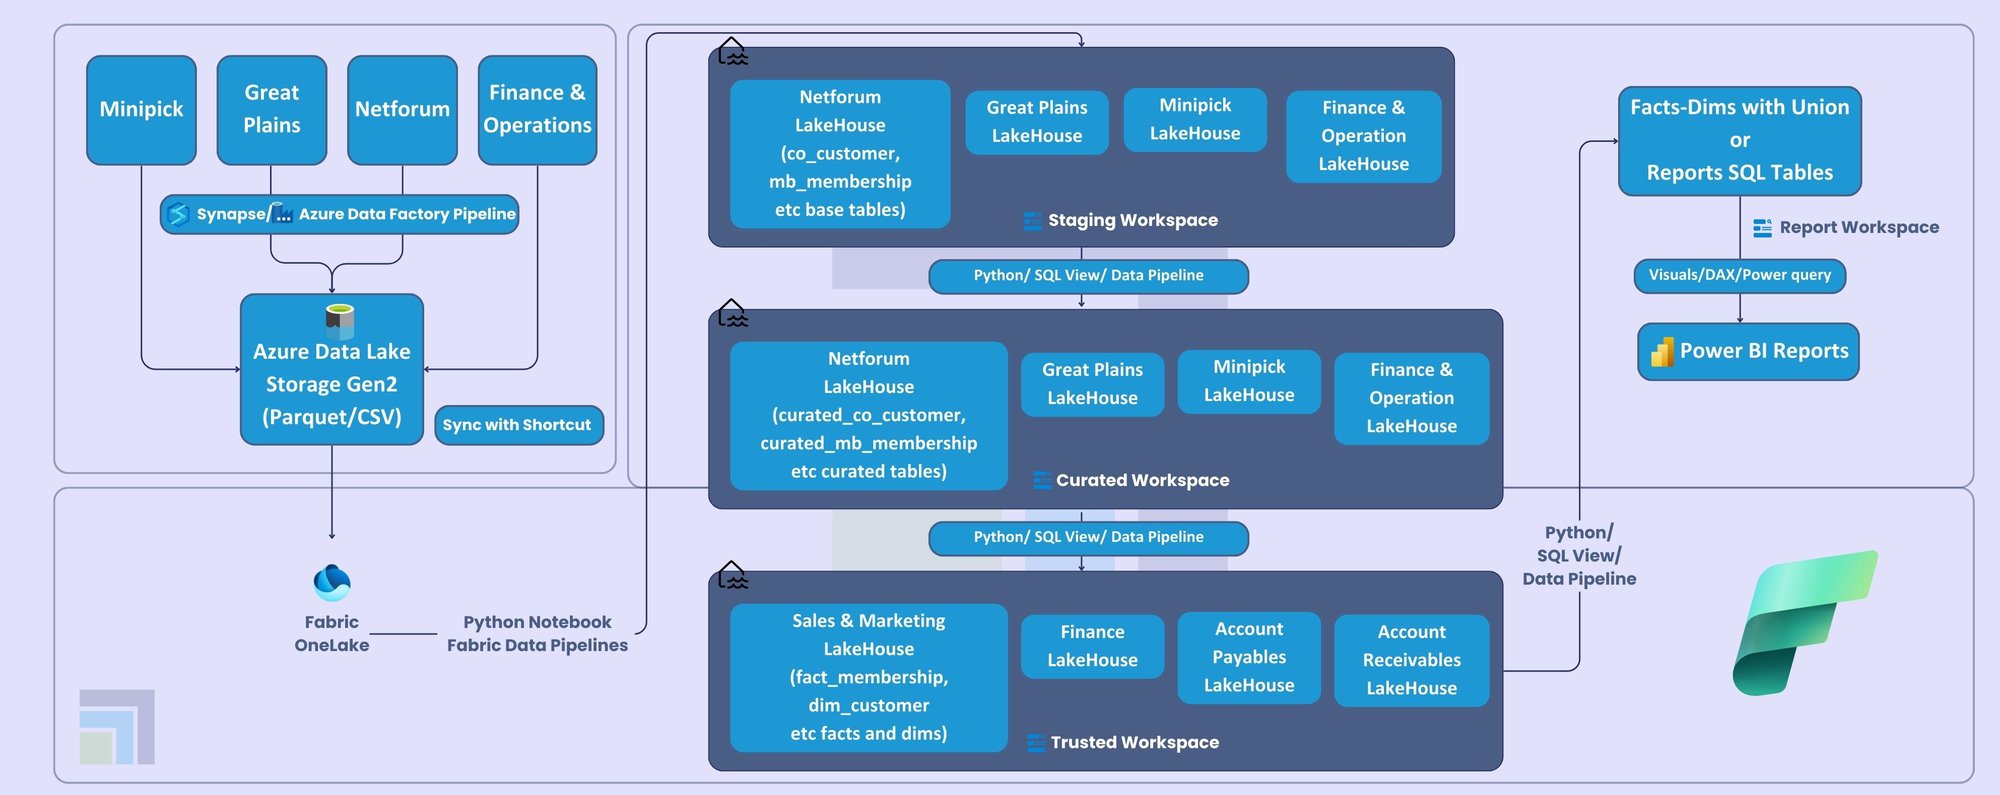
Business Process Flow

Tools and Technology
Power BI and Tableau Integration
Utilize Power BI's interface for intuitive data views and insightful reports. Leverage Tableau's advanced visualization capabilities for in-depth data exploration and managing complex information.
Azure Synapse Integration
Leverage Azure Synapse's robust data storage capabilities to store your Dynamics 365 data securely. Streamline ETL processes within Azure Synapse to ensure accurate and timely data for analysis.
Data Analytics Dashboard
Easily access real-time insights at your fingertips. Get a centralized view of your critical data, visualize your key performance indicators, track trends, and make informed decisions through customizable widgets and interactive charts.
Efficient Report Builder
Whether it's financial reports, sales analyses, or operational performance data, our robust Report Builder ensures your data is not only informative but also visually captivating.
Data Integration Capabilities
Get a seamless and unified view of all your data. Whether your data resides in databases, cloud platforms, or spreadsheets, our Power BI Dynamics 365 connector consolidates information from different locations into a single, coherent source.
Predictive Analytics
Foresee trends, identify potential risks, and make data-driven forecasts. Analyze historical data and easily recognize patterns to make smart, strategic decisions. Get complete control of scenario planning and budget forecasting.
Data Visualization
Present intricate data in user-friendly and visually appealing formats. Whether it's pie charts, bar graphs, heat maps, or geographic maps, you can choose the most suitable visualization method.
Security and Compliance
Our solution includes robust security measures and tools to safeguard your data privacy while adhering to industry-specific and regional regulations. We prioritize data confidentiality and integrity while you leverage data for growth.


