 06 Jul 2026
A failed batch job rarely gets noticed when it happens.
An invoice posting process fails overnight. An MRP run stops midway through execution. A DMF import remains stuck for hours. Without Azure Monitor in place, these issues often surface only after users report missing transactions, delayed processing, or broken integrations.
The challenge is not identifying batch failures. Most IT teams can do that eventually.
The challenge is identifying them before they disrupt business operations.
As Dynamics 365 Finance & Operations environments become more automated and transaction volumes continue to grow, manual monitoring becomes increasingly unreliable. Critical workloads can fail silently while downstream processes continue accumulating risk.
This is where Azure Monitor Alerts become valuable. By combining telemetry, alerting, and centralized visibility, organizations can detect batch failures automatically, notify the right teams, and respond before operational issues escalate.
This guide explains how to build an effective alerting strategy for D365 batch processing using Azure Monitor, Azure Log Analytics, and modern ERP monitoring practices.
Why Azure Monitor Is Critical for D365 Batch Monitoring
Batch processing powers many of the most important operations in Dynamics 365 Finance and Operations. Processes such as invoice posting, inventory updates, MRP execution, financial settlements, and data integrations often run in the background with little direct user visibility.
When a batch job fails, the impact is rarely isolated to a single task. A missed execution can delay downstream processes, disrupt reporting timelines, create data inconsistencies, or affect operational decision-making across departments.
The challenge is that many failures do not generate immediate visibility. In environments that rely on manual reviews of batch history, issues may remain undetected for hours or even days.
This is where Azure Monitor becomes valuable.
Rather than waiting for users to report problems, organizations can continuously monitor batch activity, identify failures automatically, and notify the appropriate teams when predefined conditions are met. This reduces the time between failure detection and remediation while improving overall operational reliability.
Common scenarios where proactive monitoring delivers significant value include:
- Failed invoice posting batches
- Delayed MRP processing
- Stalled Data Management Framework (DMF) jobs
- Integration-related batch failures
- Long-running financial processing tasks
- Repeated batch retry failures
Common Consequences of Unmonitored Batch Failures
| Operational Impact | Business Risk |
| Delayed invoice posting | Cash flow disruption |
| Failed inventory updates | Inventory inaccuracies |
| Missed MRP processing | Production delays |
| Integration failures | Data inconsistencies |
| Delayed financial processing | Reporting inaccuracies |
| Increased manual intervention | Higher operational costs |
This is where Azure Monitor Alerts help organizations move from reactive troubleshooting to proactive issue detection.
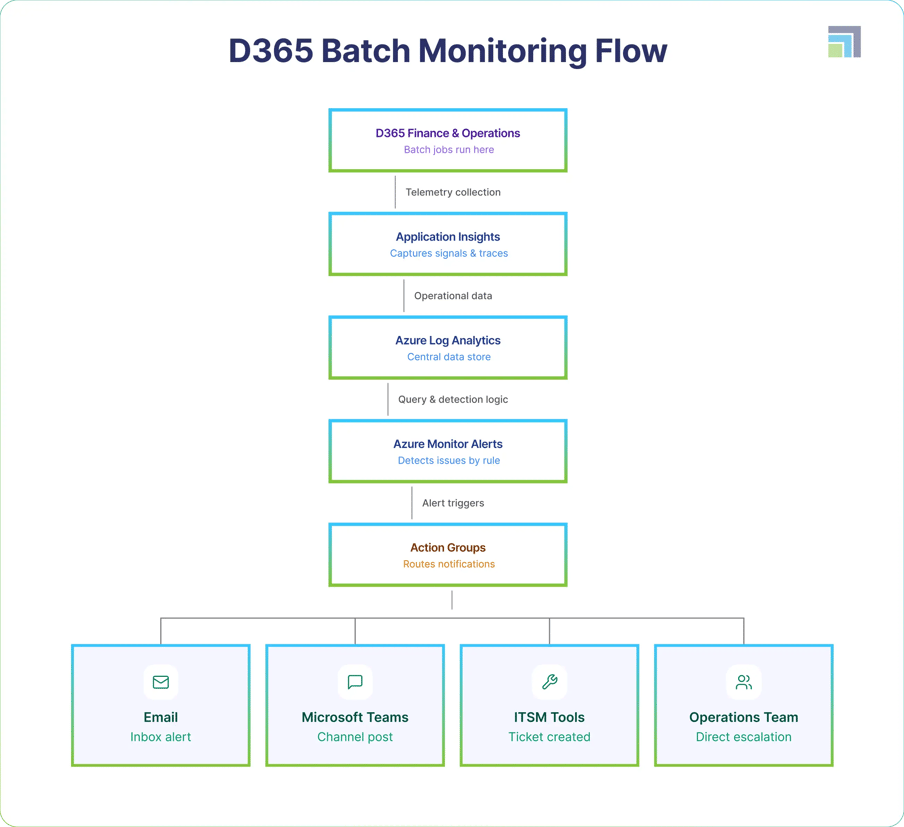
Understanding the D365 Monitoring Architecture
Before creating alerts, it is important to understand how monitoring data typically flows through the environment.
Prerequisites Before Configuring Azure Monitor Alerts
Before creating alert rules, organizations should verify that the required monitoring components are available and properly configured.
At a minimum, administrators should have:
- Access to Azure Monitor
- Access to Azure Log Analytics
- Appropriate permissions to create and manage alert rules
- Telemetry flowing from the Dynamics 365 environment
- Notification channels identified for alert delivery
Organizations should also determine which batch workloads require monitoring, along with the severity levels and escalation paths that will be used when alerts are triggered.
Completing these prerequisites helps ensure alerts can be implemented efficiently and aligned with operational requirements.
Once the monitoring architecture, telemetry, and permissions are in place, administrators can begin configuring Azure Monitor Alerts for D365 batch failures. The following steps outline a practical approach for detecting failed batch jobs and notifying the appropriate teams when issues occur.
Step 1: Define Your Batch Failure Monitoring Scope
Before creating Azure Monitor Alerts, determine which batch processes require proactive monitoring.
In most Dynamics 365 Finance & Operations environments, not every batch job warrants an alert. The objective is to focus on workloads whose failure could affect financial operations, supply chain activities, integrations, or business-critical reporting.
Common candidates include:
- Invoice posting jobs
- MRP processing
- Cost calculation batches
- Inventory reconciliation processes
- Data Management Framework (DMF) jobs
- Financial closing activities
- Integration-related batch workloads
This exercise helps organizations prioritize monitoring efforts, establish appropriate alert severity levels, and reduce unnecessary alert noise.
Step 2: Centralize Monitoring Data with Azure Log Analytics
Effective alerting depends on reliable telemetry.
Azure Log Analytics serves as the central location for collecting, storing, and analyzing operational data across the ERP environment.
Using Azure Log Analytics, organizations can:
- Consolidate monitoring data
- Analyze operational trends
- Investigate failures
- Build alerting logic
- Correlate performance issues across systems
A centralized monitoring repository is particularly valuable in complex environments where multiple business processes, integrations, and workloads interact with Dynamics 365 Finance & Operations.
Step 3: Define Conditions for Batch Failure Detection
One of the most important decisions when configuring Azure Monitor Alerts is determining what constitutes a failure.
Different organizations may define alert conditions differently based on operational requirements.
Common alert scenarios include:
- Batch jobs entering a failed state
- Jobs exceeding expected execution duration
- Consecutive retry failures
- Processing backlogs
- Queue growth beyond defined thresholds
- Critical workloads missing execution windows
The objective is to detect meaningful issues without creating excessive alert volume.
Organizations that generate too many alerts often experience alert fatigue, reducing the effectiveness of their monitoring strategy.
Step 4: Create Azure Monitor Alert Rules
Once monitoring data and detection criteria have been established, organizations can create Azure Alert Rules to automatically identify batch failures.
A well-designed alert rule should define:
| Alert Component | Purpose |
| Data Source | Monitoring data used for evaluation |
| Evaluation Criteria | Conditions that trigger alerts |
| Severity Level | Business impact classification |
| Evaluation Frequency | How often conditions are checked |
| Notification Method | How stakeholders are informed |
| Escalation Path | Response workflow |
The goal is to ensure critical failures generate actionable alerts while minimizing unnecessary notifications.
Step 5: Configure Notifications and Escalation Paths
Detecting a failure is only valuable if the right people are informed quickly.
Azure Monitor Alerts can support multiple notification channels, allowing organizations to align alerting with existing operational processes.
Common notification methods include:
- Email alerts
- Microsoft Teams notifications
- SMS notifications
- Service desk ticket creation
- ITSM platform integration
- Operations team escalation workflows
The notification strategy should reflect the business criticality of the batch process being monitored.
For example, a failed month-end financial processing job may require immediate escalation, while a non-critical reporting process may only require notification during business hours.
Step 6: Use Azure Monitor Metrics for Performance Visibility
Monitoring should extend beyond failure detection.
Azure Monitor Metrics provide visibility into operational trends that may indicate future issues before failures occur.
Useful metrics include:
- Batch execution duration
- Processing throughput
- Queue depth
- Resource utilization
- Failure frequency
- Retry activity
Tracking these indicators helps organizations identify emerging bottlenecks and take corrective action before service disruptions occur.
Azure Monitoring Best Practices for ERP Monitoring
Organizations that generate the most value from ERP monitoring treat monitoring as an ongoing operational discipline rather than a collection of isolated alerts. A well-designed monitoring strategy improves visibility, accelerates issue resolution, and reduces the likelihood of business disruption.
Prioritize Business-Critical Workloads
Not every batch process requires the same level of attention. Monitoring efforts should focus on workloads that directly support financial operations, inventory management, manufacturing processes, integrations, and customer-facing activities where failures can have a measurable business impact.
Monitor Performance Trends Alongside Failures
Failed jobs represent only one category of operational risk. Gradually increasing execution times, growing queue depth, and recurring retries can often signal emerging performance issues long before a failure occurs.
Establish Meaningful Performance Baselines
Baseline metrics provide a reference point for evaluating changes in batch processing behavior, especially when using Azure Log Analytics with Power BI to improve operational visibility and reporting. This becomes particularly valuable when validating platform updates, configuration changes, customizations, or infrastructure modifications.
Design Alert Rules to Minimize Noise
Alert fatigue remains one of the most common challenges in enterprise monitoring environments. Alert rules should be aligned to actionable events and meaningful thresholds to ensure critical notifications receive prompt attention.
Continuously Review and Refine Monitoring Coverage
Business processes, integrations, and operational priorities evolve over time. Periodic reviews of Azure Monitor Alerts, thresholds, and escalation paths help ensure monitoring remains aligned with current business requirements and system workloads.
Common Mistakes When Configuring Azure Monitor Alerts
Even mature organizations can struggle with monitoring effectiveness if alerting is not properly designed.
Monitoring Too Many Jobs
Attempting to alert on every batch process often creates unnecessary complexity and alert fatigue.
Ignoring Business Impact
Technical failures should be evaluated based on their operational consequences rather than technical severity alone.
Using Static Thresholds Everywhere
Different workloads have different performance characteristics. Thresholds should reflect actual business requirements.
Failing to Test Alerts
Alert rules should be validated periodically to ensure notifications and escalation paths function as expected.
Treating Monitoring as a One-Time Project
Monitoring strategies should evolve alongside business processes, transaction volumes, application changes, and broader visibility initiatives such as Microsoft Sentinel for Dynamics 365.
How DynaTech Helps Simplify ERP Monitoring
While organizations can configure Azure Monitor Alerts manually, building and maintaining a comprehensive monitoring framework often requires significant effort.
Many teams must manage telemetry collection, alert creation, dashboard development, escalation workflows, reporting, and ongoing tuning.
DynaTech's D365-focused monitoring framework helps organizations accelerate this process through pre-configured monitoring capabilities designed specifically for Dynamics 365 Finance & Operations.
This includes visibility into:
- Batch processing health
- Queue depth trends
- Failed batch detection
- Form performance monitoring
- Dynamics 365 slow forms performance
- Operational telemetry
- AI-assisted diagnostics
- Automated reporting
Rather than building every alert from scratch, organizations can implement monitoring capabilities faster and focus on resolving issues rather than configuring infrastructure.
Wrapping Words
Batch failures can disrupt critical business processes long before users realize something has gone wrong. As Dynamics 365 Finance & Operations environments become more complex, relying on manual monitoring becomes increasingly risky.
By combining Azure Monitor, Azure Log Analytics, Azure Monitor Metrics, and well-designed Azure Monitor Alerts, organizations can improve visibility, reduce operational risk, and respond to issues faster.
A proactive ERP monitoring strategy not only helps detect failures earlier but also provides the operational insights needed to maintain a reliable and scalable Dynamics 365 environment with support from an experienced Dynamics 365 partner.