As organizations rely more heavily on data-driven decision-making, choosing the right business intelligence platform has become an important technology decision. Power BI and Tableau remain two of the most widely used platforms for data visualization, analytics, and business reporting.
But the choice between Power BI vs Tableau is no longer simply about which platform offers better dashboards. Pricing, data modeling, visualization capabilities, AI features, security, governance, integration, scalability, and total cost of ownership can all influence the right choice.
In this guide, we compare Power BI vs Tableau , including their features, pricing, data visualization capabilities, security, limitations, and ideal use cases to help you determine which platform is better suited to your organization.
What is Power BI?
Power BI is developed by Microsoft in 2015. It is a very powerful tool for data visualization and business intelligence. It has grown rapidly and seamlessly integrated with other products of the Microsoft ecosystem, including Microsoft Dynamics 365. Power BI is highly popular for its user-friendly interface, affordability, and extensive data connectors. Power BI is a newer yet strong competitor of Tableau.
Robust Power BI Features
-
Data Connectivity: Power BI connects with databases, cloud platforms, files, business applications, and other data sources.
-
Data Transformation: Power Query enables users to clean, transform, and prepare data before analysis.
-
Data Modeling: Power BI uses semantic models and DAX to create relationships, calculations, measures, and analytical logic.
-
Interactive Reporting: Users can build interactive reports and dashboards with filters, drill-downs, KPIs, and a wide range of visualizations.
-
AI-Assisted Analytics: Power BI continues to incorporate AI-assisted capabilities that help users explore data, generate insights, and work with reports more efficiently.
-
Microsoft Fabric Integration: Power BI is integrated into Microsoft Fabric, allowing organizations to connect business intelligence with data engineering, data warehousing, data science, real-time analytics, and other workloads.
-
Real-Time Analytics: Power BI can support real-time and near-real-time reporting scenarios when connected to appropriate streaming and real-time data sources.
Power BI Pros and Cons: A Complete Overview
|
Pros |
Cons |
|
Strong integration with Microsoft 365, Azure, Dynamics 365, and Fabric. |
Advanced DAX can have a significant learning curve. |
|
Strong data modeling and semantic modeling capabilities. |
Complex data models require experienced development. |
|
Broad range of data connectors. |
Advanced enterprise capabilities may require higher licensing or capacity. |
|
Strong self-service and enterprise reporting capabilities. |
Highly customized visualizations may require additional effort. |
|
Flexible user-based and capacity-based options. |
Poorly designed models can affect report performance. |
|
Strong security and governance capabilities. |
Licensing can become complex for large deployments. |
What is Tableau?
Tableau was founded in 2003 and later acquired by Salesforce in 2019. It is a well-known BI tool that offers stunning visualizations. It has the ability to manage large datasets. It is specifically developed for users you need advanced analytics features with robust customization options. It allows businesses to simplify their process of data analysis. It has over 1 million members and 500+ user groups across the globe.
Powerful Tableau Features
- Nested sorting: Nested sorting enables users to select the field value used to identify the sort order.
- Data Highlighter: Tableau showcases specific fields or groups. This allows users to explore data interactively when viewing huge data sets.
- Workbook Formatting: With this feature, users can easily change themes, fonts, and other format settings. This can be done at the workbook level instead of doing it at the worksheet level.
- Custom Territories: Users craft custom territories by simply grouping locations together on the map. They can even use built-in territories such as area codes or countries.
- Data blending: The data blending feature enables the user to integrate data from multiple sources. Users can easily analyze related data from different sources in a single view.
- Data collaboration and data notifications: Tableau allows users to easily collaborate with their team members. They can simply store data on-premises, in the cloud, or in a hybrid environment.
- Toggle view and drag-and-drop: Tableau is a user-friendly tool that allows its users to filter data points. This can be done with a single click or by using drag and drop fields to view the data.
- Dashboard commenting: Users can add comments in real-time to Tableau dashboards. This can help improve communication and performance.
Tableau Pros and Cons: A Complete Overview
|
Pros |
Cons |
|
Strong data visualization and visual analytics capabilities. |
Licensing can become expensive as deployments grow. |
|
Highly customizable dashboards. |
Advanced capabilities can require specialized skills. |
|
Strong data exploration capabilities. |
May require additional integration in Microsoft-centric environments. |
|
Powerful geospatial visualization. |
Administration and governance require planning. |
|
Strong support for analytical workflows. |
Migration from an existing BI platform can create additional costs. |
|
Suitable for complex visual storytelling. |
Total cost can extend beyond the software license. |
The Ultimate Tableau VS Power BI Comparison
|
|
Power BI |
Tableau |
|
Parent Company |
Microsoft |
Salesforce |
|
Year |
2013 |
2003 |
|
Pricing |
Cost-friendly |
Expensive |
|
Licensing |
No license keys needed |
Need license keys |
|
Size |
Meant for small, medium, and large-scale organizations |
Only for large-scale enterprises |
|
Performance |
Offers great performance in data visualization, manipulation, and integration |
Offers great performance in hypothetical visualization, and ad-hoc data analysis. Can handle large data sets. |
|
Security |
Offers Row-Level Security and Role Restriction Capabilities. |
Renders Row-Level Security. Users can set up filters as well. |
|
Learning Curve |
For beginners and experts |
Best suited for expert data analysts |
|
Language Used |
Uses DAX (Data Analysis Expression) for calculated columns and measures |
Uses MDX (Multidimensional Expressions) for dimensions and measures. |
|
Supported Language |
R language-based visualizations |
Fully integrated support for R and Python |
|
Deployment |
– On Cloud |
– On Cloud |
|
SQL Support |
Yes |
Yes |
|
Data Capacity |
Large semantic model storage & Fabric capacity, models can exceed 10 GB. |
Can handle billions of data without any need for cloud services |
|
User Friendliness |
Easy to Use |
Needs more time and expertise to use |
Power BI VS Tableau Comparison
1. Data Visualization
Tableau
Tableau is widely known for its data visualization features. It enables users to develop custom interactive dashboards that are compatible with other devices. Tableau also renders pre-installed information on geographical data like postal codes, cities, administrative boundaries, etc. It also offers different kinds of maps like Choropleth maps, Heat maps, Flow maps, and Point distribution maps.
Power BI
On the other hand, Power BI renders data visualization with the help of various data points. The easy drag-and-drop feature is a great option, especially for non-technical users. Its visualizations include Bar/Stacked/Cluster charts, Line charts, Area charts, Funnel charts, and Ribbon charts. It offers various visualization options ranging from simple charts like Pie charts or Bar charts to critical ones like Gantt charts, Bullet charts, boxplots, etc.
2. Products
Power BI
It is a part of the Microsoft Business Intelligence MSBI Suite. It offers a range of products and services like:
- Power BI Desktop: Offers a free visualization and reporting tool.
- Power BI Service: It is a cloud-based service to publish and share reports and dashboards. It comes in three license versions -Free, Pro, and Premium.
- Power BI Pro: It is a self-service BI tool in the cloud.
- Power BI Premium: It is a cloud-based and AI integrated advanced analytics and data visualization service.
- Power BI Mobile: Simply access Power BI dashboards anytime, anywhere with this intuitive mobile app.
- Power BI Report Server: It is an n-premise enterprise reporting server available in two licenses: Power BI Premium and SQL Server Enterprise Edition
- Microsoft Fabric: It is a SaaS platform for self-service analytics. It syncs all the data engineering, data warehousing, and security parts, on a unified cloud portal.
Tableau
- Tableau Server: It is an enterprise-level online platform that helps to handle data and data sources.
- Tableau Public: It is a free platform that helps to develop and publicly share data reports as well as visualizations.
- Tableau Online/Cloud: It is a fully-hosted, cloud-based, analytics platform. It helps to easily share data.
- Tableau Desktop: Just like Power BI Pro, it is a powerful self-service business analytics and data visualization tool.
- Tableau Prep: It is a visual tool for smoothly handling data.
- Tableau Reader: It is a free desktop app where the users can view and interact with data visualizations.
- Tableau Mobile: It is an app for Tableau Online and Tableau Server. The users can access their Tableau in a single click.
3. Cost
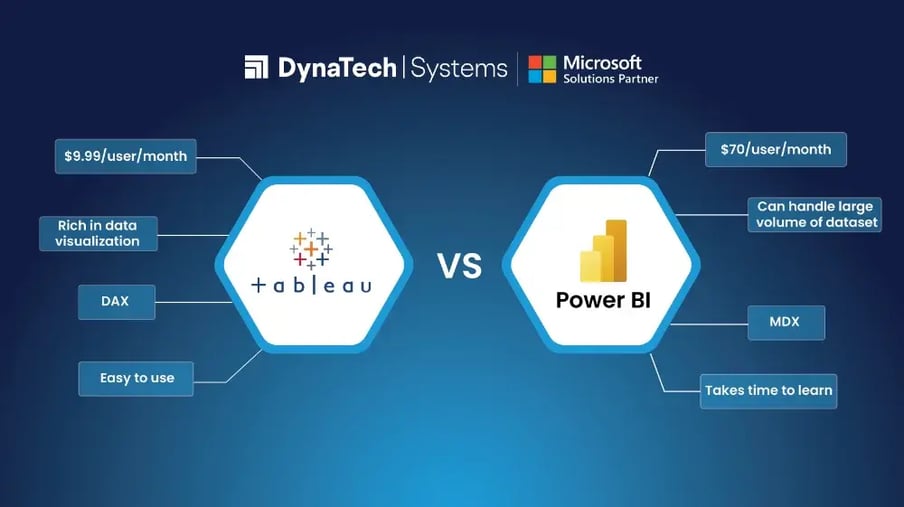
In the Power BI VS Tableau Cost battle, Tableau is definitely the more expensive one. Tableau’s Pro version’s yearly subscription is 10x more than the Power BI Pro version’s yearly subscription.
For organizations who want cost friendly option or are already using Microsoft’s suite, Power BI must be considered. Even startups or SMEs can consider Power BI. They can upgrade to Tableau eventually when their business grows.
|
Pricing Factor |
Power BI |
Tableau |
|
Free option |
Power BI Free |
Tableau Public |
|
Entry paid plan |
Power BI Pro – $14/user/month |
Viewer – $15/user/month |
|
Advanced user plan |
Power BI Premium Per User – $24/user/month |
Explorer – $42/user/month |
|
Creator / Authoring |
Included with Pro / PPU |
Creator – $75/user/month |
|
Enterprise option |
Fabric Capacity / enterprise capacity |
Enterprise Edition / Tableau Cloud |
|
Billing |
Per user/month; paid annually |
Per user/month; billed annually |
|
Best suited for |
Microsoft-centric organizations, business users, enterprise reporting |
Visual analytics, data exploration, advanced dashboarding |
4. Security
Power BI
Power BI provides enterprise security and governance capabilities including row-level security, identity and access management, workspace permissions, data governance, and controlled sharing. Its integration with Microsoft's broader security and identity ecosystem can be particularly valuable for organizations already using Azure and Microsoft cloud services.
Tableau
In Tableau, users can configure high-end data security, proper authentication, and top-notch network security. Tableau offers pre-set user roles like:
- Viewer
- Interactor
- Editor
Tableau provides enterprise security and governance capabilities through authentication, permissions, user roles, data access controls, and row-level security approaches. Organizations can configure governance policies based on their deployment model and data access requirements.
5. Dashboards
Power BI
Power BI offers modern features that can transform raw data into intuitive, visually appealing dashboards. It enables users to see data insights without the need for any prior experience. Also, Power BI’s dashboards are very simple and easy to use.
Power BI Dashboard
Tableau
Tableau offers powerful features like Power BI. But, when compared to Power BI, various features are hidden behind the menus. Tableau is also popular for its visually stunning dashboards. It offers a quick and easy drag-and-drop feature to create dashboards.
Tableau Dashboard
6. Data Sources
|
Popular Data Source |
Power BI |
Tableau |
|
Adobe Analytics |
Yes |
No |
|
Amazon Redshift |
Yes |
Yes |
|
Alibaba Data Lake and Analytics |
No |
Yes |
|
Excel |
Yes |
Yes |
|
|
Yes |
No |
|
Google Analytics |
Yes |
Yes |
|
Google Ads |
No |
Yes |
|
BigQuery |
Yes |
Yes |
|
Hadoop |
Yes |
Yes |
|
IBM DB2 |
Yes |
Yes |
|
MySQL |
Yes |
Yes |
|
Oracle |
Yes |
Yes |
|
PostgreSQL |
Yes |
Yes |
|
R Script |
Yes |
Yes |
|
Python Script |
Yes |
Yes |
|
SalesForce Report |
Yes |
Yes |
|
Spark |
Yes |
Yes |
|
SQL Server |
Yes |
Yes |
|
JSON |
Yes |
Yes |
|
Azure SQL |
Yes |
Yes |
|
Text File |
Yes |
Yes |

Still Deciding Between Power BI and Tableau?
The right BI platform depends on more than features and pricing. Your existing technology stack, data architecture, users, and long-term analytics strategy all matter.
Conclusion
While choosing the best between Power BI and Tableau, the final decision mostly depends on the unique needs and requirements of your organization. Power BI is best-fitted for businesses already using Microsoft products. It renders an affordable and user-friendly solution with powerful AI and automation capabilities. On the other hand, Tableau is a great choice for experienced and skilled data professionals who need advanced analytics and deep visual customization but for a higher price.
Whether you prioritize ease of use, budget, or advanced data handling capabilities, both Power BI and Tableau are exceptional tools in the business intelligence market. Can you choose the best one? A reliable IT consultant company can help you choose the best solution for your firm.
FAQs