

Your Power BI Reports Are Only as Good as the Model Behind Them
A Power BI dashboard can look polished and still give users inconsistent answers. One report calculates revenue differently from another. A business user sees technical field names they don't understand. Analysts spend time rebuilding the same calculations instead of analyzing the results.
The missing piece is often the semantic model in Power BI.
A semantic model gives data structure and meaning before it reaches the report. It defines relationships, measures, business terminology, and the logic users rely on for analysis. Microsoft describes Power BI semantic models as a business-friendly layer over enterprise data that supports consistent reporting and analysis.
And this is not a niche reporting capability. Microsoft says Power BI is now used by more than 375,000 organizations worldwide, with 30 million monthly active users. (Power BI)
So, what is a semantic model in Power BI, why does it matter, and how should you build one?
What Is a Semantic Model in Power BI?
A semantic model is a structured layer that sits between your underlying data and the reports, dashboards, and analytical experiences built on top of it.
Think of it as the layer that answers a simple question:
What does this data actually mean to the business?
A semantic model can define:
- Relationships between tables
- Measures and calculations
- Business-friendly names
- Hierarchies
- Data categories
- Formatting
- Security rules
- Metadata and descriptions
Microsoft describes a semantic model as a logical description of an analytical domain containing metrics and business-friendly terminology.
You may also see older Power BI documentation referring to datasets. Microsoft renamed Power BI datasets to semantic models to better represent their broader role in analytics.
A simple example makes the distinction clearer.
Suppose your source system contains:
Customer_ID
Order_Date
Net_Value
Product_ID
The semantic model can turn those technical structures into something users can actually work with:
Customer → Product → Sales → Revenue → Gross Margin → Year-over-Year Growth
The data has not magically changed. Its meaning and usability have.
How Does a Semantic Model Fit Into Power BI?
The relationship can be viewed simply:
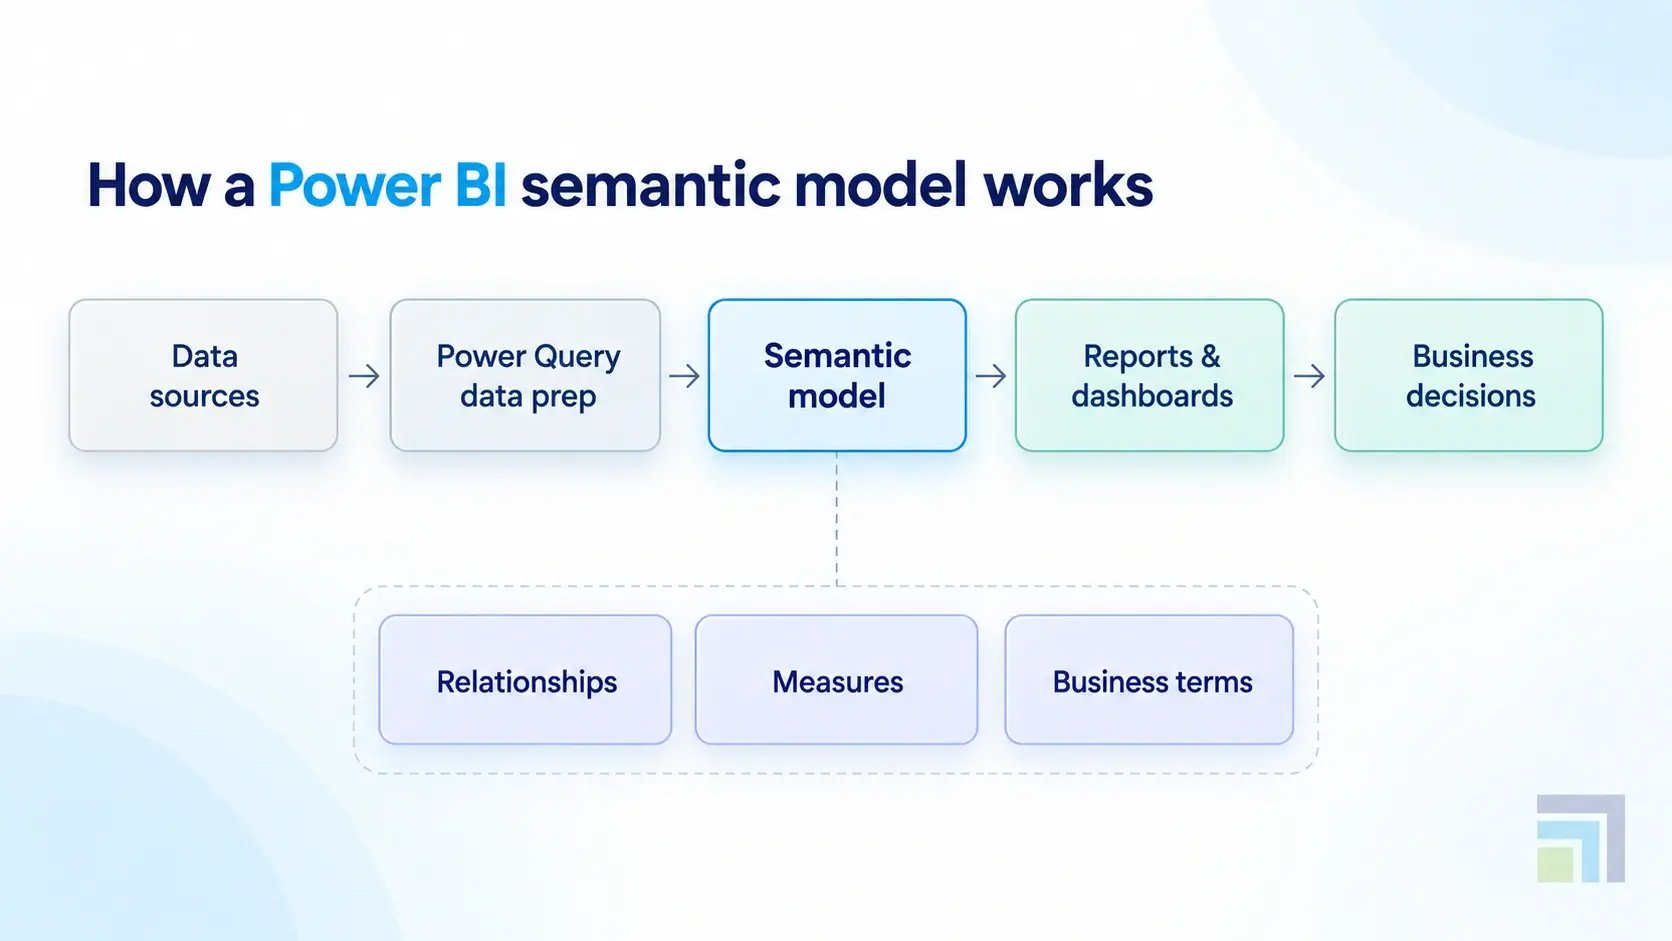
Data sources → Data preparation → Semantic model → Reports & dashboards → Business decisions
The semantic model is the reusable middle layer. Multiple reports can use the same definitions instead of recreating business logic independently.
Microsoft notes that semantic models are designed to provide data that is ready for reporting and visualization.
What Are the Benefits of Using a Semantic Model?
A good semantic model does more than organize tables. It creates a shared analytical foundation that different teams can use with confidence.
1. Consistent metrics
A company should not have three different definitions of "revenue" depending on which dashboard someone opens.
Measures can be defined centrally and reused across reports. This consistency also makes it easier to track performance against defined KPIs and apply Power BI performance optimization when reports need to scale.
2. Easier self-service analytics
Business users do not need to understand every underlying database table. They can work with familiar names, measures, and relationships instead.
3. Reusable business logic
Once calculations such as margin, conversion rate, year-over-year growth, or customer retention are defined, they can be reused rather than rebuilt in every report.
4. Better governance
A governed semantic model gives organizations greater control over definitions, access, and reporting standards.
5. Easier report development
Report creators can start with an established model instead of preparing and connecting the same data repeatedly.
Microsoft specifically highlights standardized semantic models as a way to create a shared source of truth that report creators can discover and reuse.
6. Better foundation for AI-assisted analytics
AI can only produce useful analytical answers when the underlying model has clear names, relationships, descriptions, and measures. This is also an important consideration when developing a Power BI AI analytics strategy.
Microsoft's current Power BI guidance recommends human-readable names, descriptive metadata, simplified model design, and star-schema practices when preparing semantic models for Copilot.
What Can You Use a Power BI Semantic Model For?
The answer is broader than dashboards.
A Power BI semantic model can support:
|
Use case |
What the semantic model provides |
|
Executive reporting |
Consistent KPIs across leadership dashboards |
|
Financial analytics |
Standardized revenue, cost, margin, and profitability measures |
|
Sales analytics |
Pipeline, conversion, quota, and customer metrics |
|
Customer analytics |
Customer segments, retention, acquisition, and lifetime value |
|
Supply chain |
Inventory, procurement, fulfillment, and operational metrics |
|
Manufacturing |
Production, quality, downtime, and efficiency measures |
|
Healthcare |
Operational, financial, and service-level analysis |
|
Self-service BI |
Reusable data structures for business users |
|
AI-assisted analytics |
Structured business context for natural-language questions |
For a business running Dynamics 365, for example, a semantic model can bring together sales, finance, customer, or supply chain data to support Power BI for Dynamics 365 scenarios. This can help deliver Dynamics 365 data insights with Microsoft Fabric through a consistent analytical layer.
The important part is that Dynamics 365 is one possible data context, not a requirement. Semantic models can sit over many different enterprise data sources.

Build Better BI Models
Struggling with inconsistent metrics or complex model dependencies? Our Power BI experts can help you design a scalable, governed semantic model your teams can trust.
Power BI Semantic Model vs Data Model: What's the Difference?
The terms are closely related, which is why Power BI semantic model vs data model can be confusing.
A data model focuses primarily on how data is structured and related.
A semantic model adds the business-facing layer used for analytics: measures, relationships, terminology, metadata, and reusable calculations.
|
Data model |
Power BI semantic model |
|
Defines data structure |
Defines analytical structure and meaning |
|
Focuses on tables and relationships |
Adds measures, business logic, and metadata |
|
Can be technical |
Designed for analytical consumption |
|
May sit close to the source |
Acts as a reusable layer for reports |
|
Supports data organization |
Supports consistent reporting and analysis |
This does not mean a semantic model replaces the underlying data model or database. It provides an analytical representation of that data.
How to Create a Semantic Model in Power BI
If you're searching for how to create a semantic model in Power BI, the process should begin with the analytical requirement, not with a list of tables.
1. Define what users need to answer
Start with questions such as:
- What are we trying to measure?
- Which dimensions do users need to analyze?
- Which metrics must remain consistent?
- How frequently does the data need to update?
- Who should have access?
This prevents the model from becoming a dumping ground for every available field.
2. Connect and prepare the data
Power BI uses Power Query to connect to and transform source data. Microsoft recommends shaping source data appropriately before building the semantic model. For larger or more complex environments, Microsoft Fabric architecture services can help structure the broader data foundation around these analytical requirements.
3. Define fact and dimension tables
A common approach is the star schema.
Fact tables contain measurable business events, while dimension tables provide the context used to filter and analyze those events.
For example:
Sales Fact
- Sales Amount
- Quantity
- Discount
- Cost
Dimensions
- Customer
- Product
- Date
- Region
- Salesperson
Microsoft recommends star-schema design for Power BI semantic models because it supports performance and usability.
4. Create relationships
Relationships determine how filters move between tables. They need to be designed carefully because poorly structured relationships can produce confusing results.
5. Create reusable measures
Use DAX measures for calculations that users will repeatedly need.
Instead of allowing every report creator to calculate gross margin differently, define the measure once and make it available through the shared semantic model.
6. Add business-friendly metadata
Names such as Net_Sales_Amt may make sense to a database developer but not necessarily to a sales manager.
Use clear names and descriptions. This becomes even more important as organizations introduce AI-assisted analytics. Microsoft's current guidance recommends descriptive metadata, consistent naming, and removal of unnecessary model objects.
7. Test before publishing
Check:
- Measure calculations
- Relationships
- Refresh behavior
- Query performance
- Security
- Model size
- User experience
A semantic model is not finished when it technically works. It should also be understandable and reliable for the people who will use it.
How to Build a Semantic Model in Power BI That Scales
Knowing how to build a semantic model in Power BI is different from building one that remains useful as data and reporting requirements grow. Models scale more easily when the data behind them sits on a Microsoft Fabric unified data platform, where storage, governance, and analytics share one foundation.
A few decisions make a noticeable difference.
Keep the model focused
Do not add every available table simply because it is accessible.
Include what supports the analytical requirements.
Maintain a clear grain
A fact table should represent events at a consistent and understood level. Mixing different levels of detail without a clear design can lead to misleading calculations.
Use star-schema principles
Microsoft's guidance recommends separate fact and dimension tables with clear relationships. Fact tables should also maintain a consistent grain.
Avoid unnecessary complexity
Unused columns, duplicate measures, ambiguous relationships, and excessive tables make models harder to understand and maintain.
Choose storage modes deliberately
Power BI supports Import, DirectQuery, and Composite modes. Import is commonly used and provides strong query performance through in-memory analysis, while DirectQuery and composite approaches can address particular data-volume or freshness requirements.
The right choice depends on the data source, freshness requirements, scale, and reporting workload.
Can You Connect Multiple Semantic Models in Power BI?
Yes, but the answer needs a little nuance.
Can you connect multiple semantic models in Power BI? Power BI supports composite models that can connect to another Power BI semantic model through DirectQuery and combine it with additional data. In Dynamics 365 environments, Dataverse and Fabric integration for enterprise analytics can also help bring operational data into broader analytical scenarios.
For example, an organization might have an enterprise sales semantic model and want to enrich a report with additional departmental data.
Microsoft describes this as a supported composite-model scenario. (Microsoft Learn)
However, connecting models simply because it is technically possible is not always a good design decision. Additional dependencies can introduce governance, performance, security, and maintenance considerations.
Microsoft recommends keeping the organization's trusted "single version of the truth" semantic model stable and using downstream composite models for specialized needs rather than turning the core enterprise model itself into a chain of dependencies.
Power BI Semantic Model Best Practices
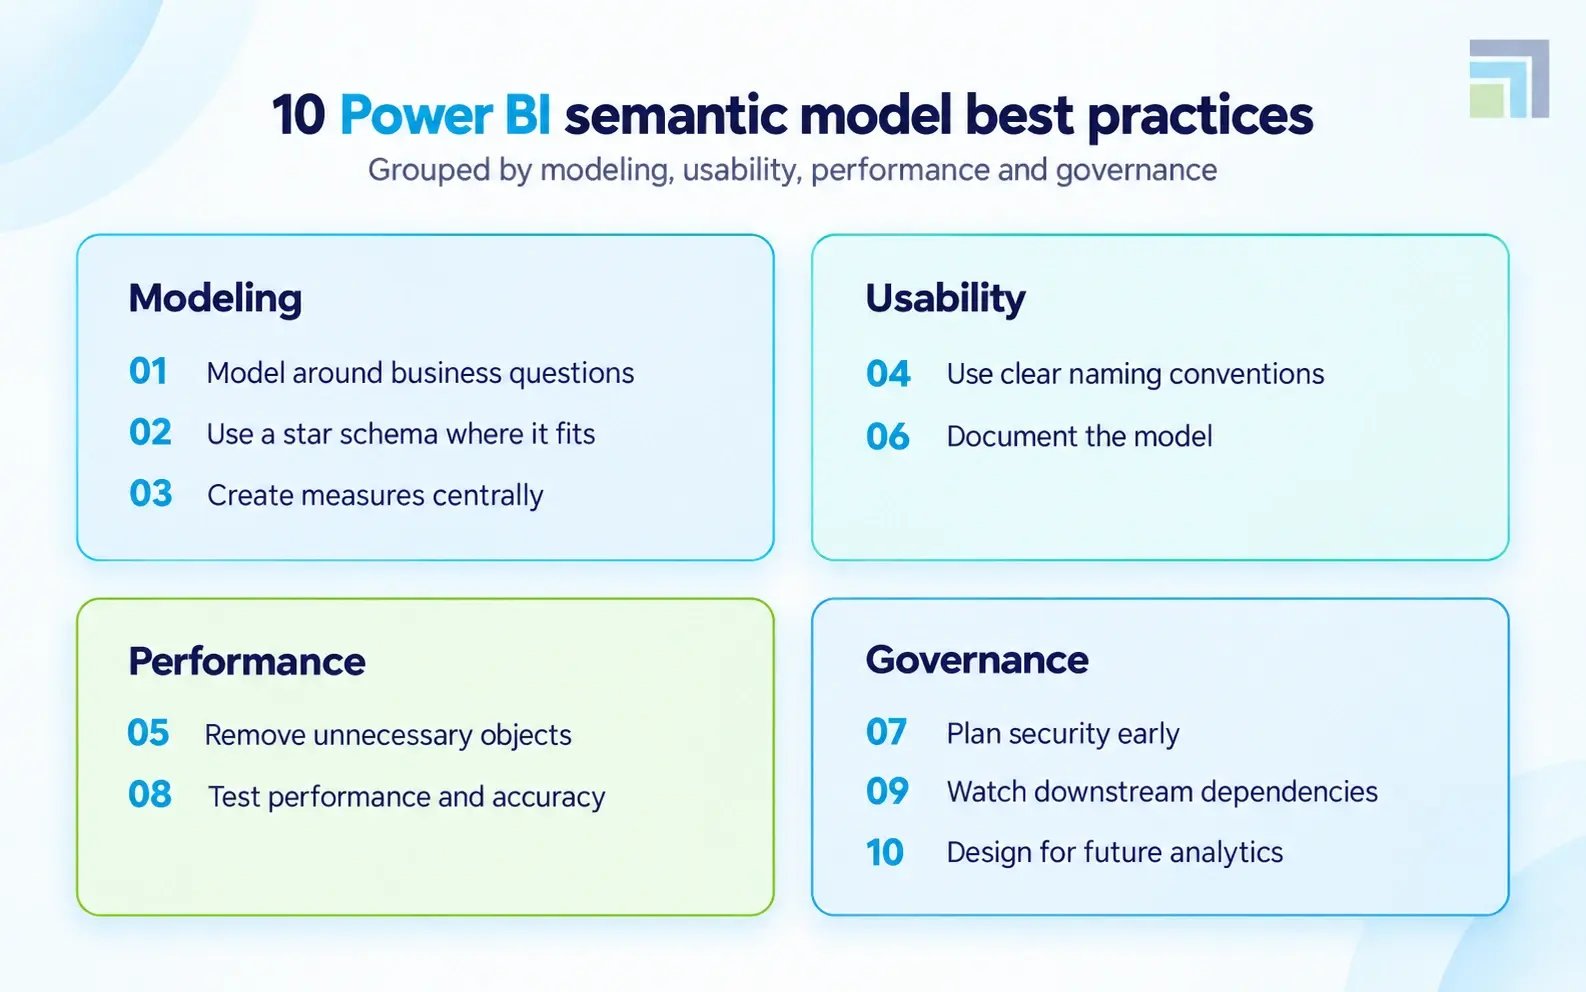
If you want a practical Power BI semantic model best practices checklist, start here:
1. Model around business questions.
Build for the decisions users need to make.
2. Use a star schema where appropriate.
Separate fact and dimension tables and maintain clear relationships.
3. Create measures centrally.
Avoid multiple definitions of the same KPI.
4. Use clear naming conventions.
A business user should understand what a field or measure represents.
5. Remove unnecessary objects.
Unused tables, columns, and measures add complexity without adding value.
6. Document the model.
Descriptions help both people and AI-assisted experiences understand what fields and measures mean.
7. Plan security early.
Access requirements should be considered during model design rather than added as an afterthought.
8. Test performance and calculations.
A model should be validated against real report workloads.
9. Think about downstream dependencies.
If other reports or composite models rely on your semantic model, changes can have wider consequences.
10. Design for future analytics.
A well-organized semantic model can support traditional reporting, self-service analysis, Microsoft Fabric data agents, and increasingly AI-assisted experiences
Power BI Semantic Model Explained With a Simple Example
Consider a distributor that wants one reliable view of sales performance.
Its source systems contain orders, customers, products, salespeople, territories, and targets.
Without a semantic model, different reports might calculate revenue, sales growth, and customer performance independently.
With a semantic model, the organization can establish:
Sales → Customer → Product → Date → Territory
Then define reusable measures such as:
- Total Sales
- Gross Margin
- Average Order Value
- Sales Growth %
- Target Achievement %
A regional sales manager can use those measures in one report. Finance can use the same definitions in another. Leadership can view the same KPIs in an executive dashboard.
The reports may look completely different.
The underlying business logic stays consistent.
That is the real value of a semantic model.
Conclusion
A semantic model in Power BI is the layer that gives business data structure before it reaches the report. It can standardize metrics, simplify self-service analytics, improve governance, and render a strong pillar for AI-assisted analysis. The best models are not necessarily the biggest ones; they are the ones designed around clear business questions and maintained with discipline. For businesses working across Dynamics 365, Azure, and other data sources, a well-designed semantic layer can bring different analytical needs together without forcing every team to rebuild the same logic. As a leading Microsoft Solutions Partner, DynaTech helps business firms design and implement Microsoft data and BI solutions that connect technology decisions to valuable business outcomes.